
新闻

-
希捷、东芝抢购TDK磁头业务:AI越火,硬盘越缺,这...
最新消息显示,希捷科技和东芝都在争夺日本TDK公司旗下的硬盘磁头业务,两家公司都希望借此跟上AI数据中心存储设备不断增长的需求。 ## 一、谁在抢?抢什么? 知情人士透露,东芝于今年春季开始...
-
阿根廷也要“卖国籍”了:35万美元起,一家四口50万...
阿根廷政府2日推出一项“投资换国籍”计划,申请人出资数十万美元就有可能成为这个南美洲国家公民。经济部长路易斯·卡普托和内阁首席部长迭戈·圣蒂利当天在法国巴黎举办的“阿根廷周”活动中共同宣布,该计...
-
发达经济体也扛不住了:利息支出超军费、超AI,全...
过去,高赤字和利息压顶,常被视为新兴市场国家的“专利”。如今,这道难题正蔓延到美国、日本、法国、英国等发达经济体。最新研究显示,高利息正在吞噬这些国家的财政空间,逼着它们重新排预算的优先级。 ##全...
-
巴菲特躺赚20亿美元!“股神”五大商社持仓收益升至200%
从2019年开始,已卸任伯克希尔首席执行官的沃伦・巴菲特对日本股票进行了一系列大手笔押注。周一东京股市大涨推高了相关个股股价,单日浮盈近20亿美元。结合伯克希尔财报公布的细节,其投资成本约为138亿美元,这...
-
飞兔商联集团董事局主席兼董事长宗家林2026丙午马...
策马扬鞭启新程 奋楫笃行铸辉煌, 以数字之力筑民族品牌 以双战之姿赴时代征程 ——飞兔商联2026丙午马年新春致辞—— 飞兔商联集团董事局主席兼董事长 宗家林 (2026 年 2 月 10 日) 尊敬的各位领导、各位合作伙伴...
Best Crypto Liquidation Map Tools in2026
发布时间:2026/03/18 区块链 浏览:809
1. Price alone never tells the full story.
The sharpest moves happen where crowded positions sit, where funding gets stretched, where open interest builds too fast.
That’s why serious traders obsess over liquidation maps. Here’s how the top 3 stack up
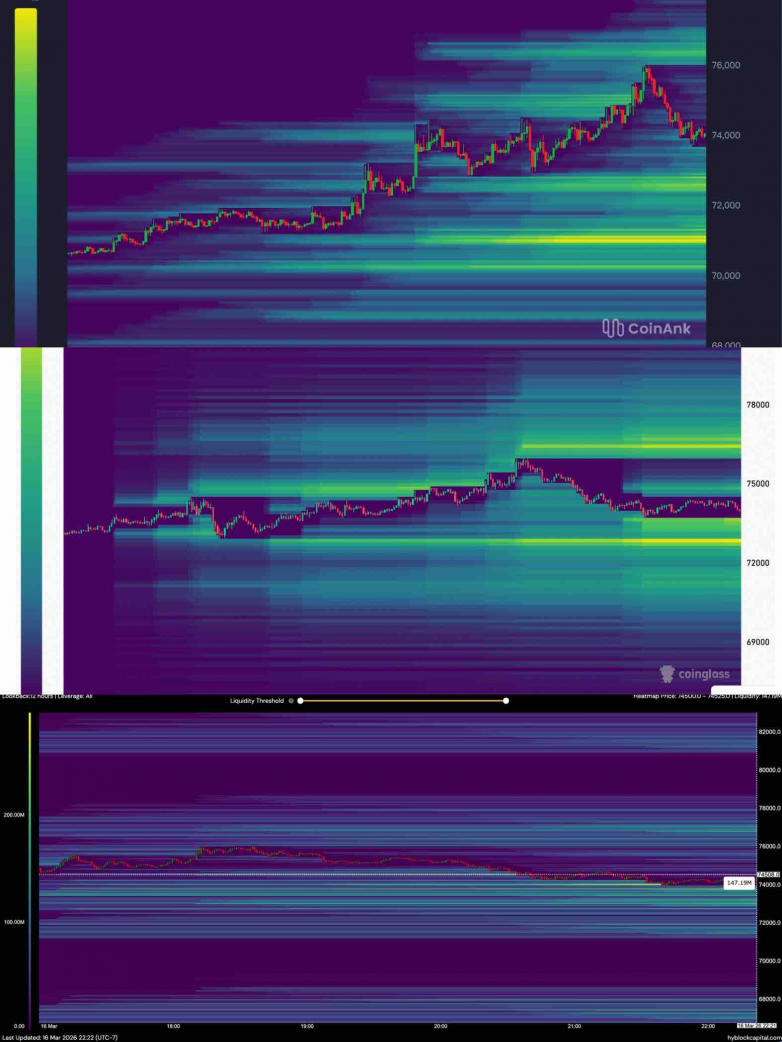
2.Why do liquidation maps matter?
When overleveraged positions get forced out, they don’t just close quietly — they add fuel to the move.
Heavy shorts above price? A breakout turns into a squeeze. Stacked longs below weak momentum? A flush hits deeper than anyone expects.
Context changes everything.
3.But a clean chart isn’t enough.
The best liquidation map tool gives you:
Real-time liquidation clusters
Funding rates
Open interest
Long/short positioning
Exchange-level signals
Order book depth
Miss one layer and you’re flying half-blind.
4. Here’s the thing most traders ignore:
A liquidation zone by itself is just noise.
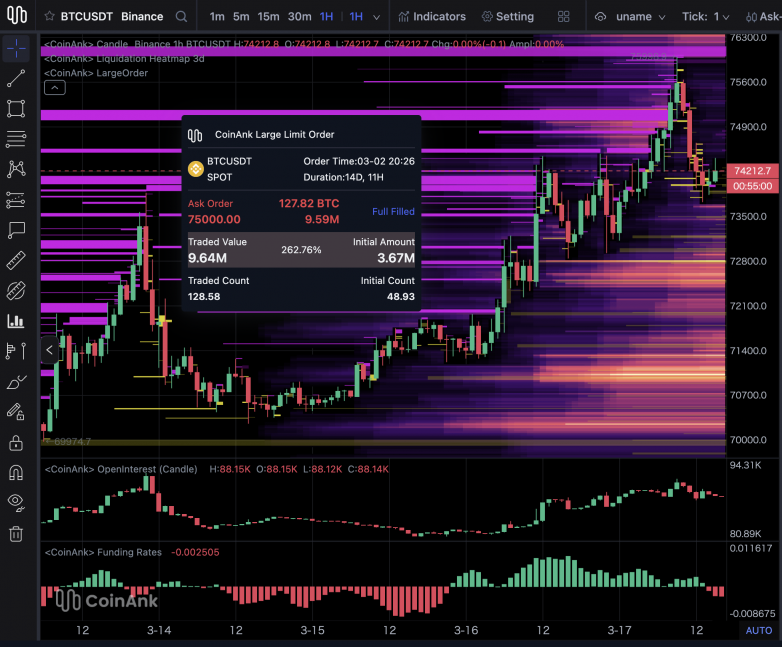
BTC approaching a dense cluster hits different when:
→ Funding is already elevated
→ OI expanded into the move
→ Order book liquidity is thinning near that level
That’s where the edge actually lives.
5. So which platform wins in 2026?
CoinAnk vs CoinGlass vs Hyblock — we broke down all three:
→ Real-time data coverage
→ Heatmap quality & UX
→ Derivatives dashboard depth
→ Fit for different trading styles
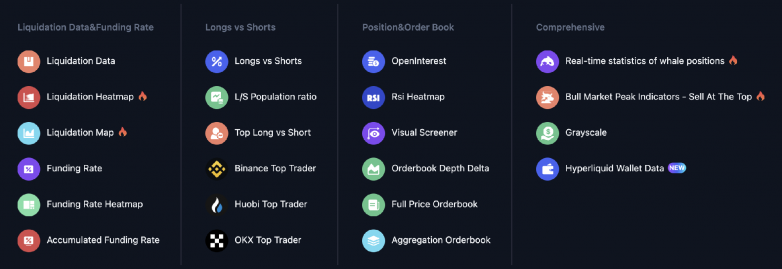
CoinAnk is a data platform focused on crypto derivatives monitoring, covering five core areas:
Liquidation Data · Funding Rates · Long/Short Positioning · Open Interest · Order Book Signals
Beyond that, it also provides real-time market metrics, heatmaps, visual screeners, and API access.
CoinAnk’s true value lies in workflow integration. There’s no need to jump between multiple tools — from liquidation heatmaps to funding rates to positioning structure, one platform handles it all.
Typical workflow: Scan heatmaps → Check funding rates → Review long/short ratio → Confirm open interest → Validate order book signals → Execute
CoinGlass is a well-known name in the derivatives space, appearing frequently in liquidation map searches with a solid established user base.
Choosing between CoinAnk and CoinGlass isn’t about brand recognition — it’s about which one fits your workflow.
If you need heatmaps, screeners, and derivatives signals in one place, and API access matters to your setup, CoinAnk deserves a serious look.
Hyblock is known for its liquidation heatmaps and market structure visuals, with a loyal following.
Traders searching for a Hyblock alternative usually have one of two needs: a different data workflow, or broader derivatives coverage in a single place.
If you currently need multiple tabs open just to complete one market analysis, CoinAnk’s consolidated dashboard can meaningfully improve your efficiency — especially during high-volatility sessions.
Which Traders Is CoinAnk Built For?
Discretionary Traders If you rely on chart structure and market sentiment, you need a clean interface with the right information density. CoinAnk pairs liquidation views with surrounding derivatives context, helping you avoid treating liquidation levels as standalone signals.
Derivatives-Focused Traders If your decisions depend on positioning structure rather than price action alone, a map isn’t enough. Is OI rising into the move? Is funding overheated? Is positioning one-sided? CoinAnk covers all of it.
API / Quant Users CoinAnk offers API access to support custom dashboards, alert systems, and quantitative workflows — for users who need more than browser-based data viewing.
Questions to Ask Before Choosing a Platform
Can you read the market fast during volatility? A good tool accelerates decisions, not slows them down.
Does the platform offer more than liquidation data? Liquidation zones paired with funding rates and OI carry far more signal weight.
Does the interface match your trading habits? Manual traders care about layout. Data users care about API.
Can it support multi-asset scanning? It’s not just BTC and ETH — screeners determine how fast you can scan the market.
Does it reduce tool switching? Attention is your most valuable resource in trading. Don’t waste it on tab hopping.
What is the best crypto liquidation map in 2026? It depends on how you trade. If you need liquidation views combined with funding rates, OI, long/short positioning, and order book signals in one place, CoinAnk is the option worth prioritizing.
Can CoinAnk replace CoinGlass? Yes. For traders who want a complete derivatives workflow under one roof, CoinAnk offers broader feature coverage and deeper workflow integration.
What makes a good Hyblock alternative? Clear liquidation visuals backed by enough supporting data to validate setups. CoinAnk’s depth of integration makes it a strong candidate worth trying.
How should you use a crypto liquidation heatmap? Use it as context, not as a standalone entry signal. Combine it with funding rate extremes, OI shifts, and order book behavior — that’s when signal reliability goes up significantly.
Can a liquidation map predict exact price movements? No. It shows areas where forced liquidations may occur, but actual price behavior still requires risk management and additional data to navigate properly.
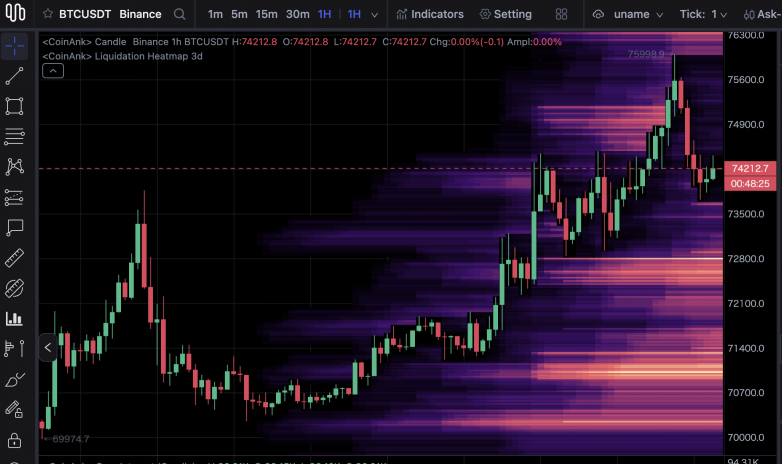
When searching for the best crypto liquidation tool, focus on workflow — not brand noise.
What you need is a platform that helps you read liquidations in context and act fast when markets move.
Visit coinank.com — compare the dashboards and derivatives data against your current process, and see if it fits.